|
A Guide to Implementing the Theory of
Constraints (TOC) |
|||||
|
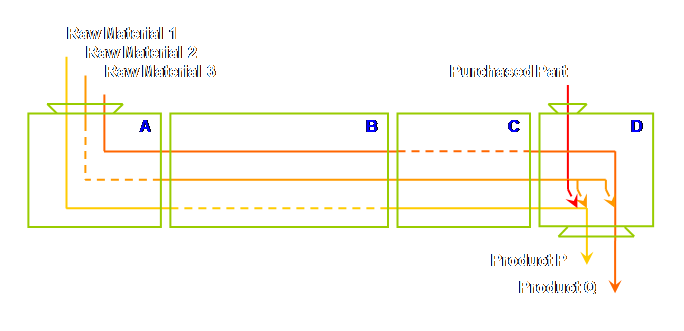
The P & Q Question Explained The P & Q is a simple process which makes just
two things; “P’s” and “Q’s.” The
objective of the exercise is to make a decision as to how to best maximize
the profit of this process. We can draw the flow of the process as follows.
We can make the process flow more explicit by
splitting out the flows for each product.
Let’s do that. For product P we have;
Let’s look at product Q. We have;
Because this is a perfect system we know exactly the
selling price and the actual demand, we also know the input prices. Let’s add these, keeping our chains
separate to keep things as simple as possible – remembering that the chains
share one physical process.
Let’s have a look.
Let’s reiterate; The selling price for P’s is $90 each and the market
demand (which is accurately known to the last unit) is 100 units per
week. The selling price for Q’s is
$100 each and the market demand is 50 units per week. In addition; The operating expense for the whole process is $6000
per week. In this ideal situation
resource availability is; 60 minutes per hour, 8 hours per day, 5 days per
week, or 2400 minutes per week. There
is never any waiting, when one step is finished; the next step is immediately
ready. Note however, there is no multitasking. Resource A, B, C, D can only do their
nominated jobs. In processes where you
might visualize the resources as people, then its not uncommon for managers
to assume, for the purposes of this exercise, that the resources can
multitask – even though in real-life they are happy for their own resources
to do the same job year in – year out. Let’s also
remind ourselves that; Profit =
throughput – operating expense, and Throughput =
selling price – material costs. Given this information, the question then is; how much profit can we generate per week from this process? Have a go at
this exercise and then, once you have an answer, any answer, return to the
measurements page. To return
to the previous page press Alt key + left arrow.
(1) Goldratt,
E. M. (1990) The
haystack syndrome: sifting information out of the data ocean. North River Press, pp 64-71. This Webpage Copyright © 2003-2009 by Dr K. J.
Youngman |